When using LargeScaleMeanShift how do I approach the different parameter settings?
I want to be able to detect smaller areas of landcover such as individual trees but I also want bigger segments for larger areas with a similar spectral signature.
What is the relationship between Spatial Radius and Range Radius?
I’m currently using the following settings and I do get big segments for some landcover but not others?
Spatial Radius: 20
Range Radius: 60
Minimum Segment Size: 50
Has anyone found specific parameters that return consistently decent results or is it a case of trial and error until you find the best values that work with your data?
If it is trial and error can you advise how to approach this?
getting the best results needs some trial and errors, but you can already define some usefull values (or identify potential issues with the algorithm) by looking at your data. Sometimes you will need two scales because what you observe by remote sensing is interpreted at different scales (e.g. the size of a large building is not the same as the size of a large forest)
minimum segment size is purely up to you, depending on your minimum mapping unit. 50 pixels is relatively large, IMHO, so you should consider the size of artefacts that you have in you image (e.g. a cow in a pasture).
2 ) the spatial radius is how far you should look in order to avoid the noise of your class, i.e. when the mean becomes relevant. It shouldn’t be too large to keep precise boundaries and relatively small object wel detected, even if mean shift is tolerant if it is too large (but this will increase your processing time). If you have repetitive patterns for some classes, take a radius of the size of the pattern) For quick test, you can use a simple mean filter (your boundaries will be affected with this filter, but check that the center of the parcels are smooth.
3 the range value is the most difficult because there isn’t usually an ideal solution: it should be equal to maximum the confidence interval around the mean value of each class, but at the same time it should be smaller than the distance between the two classes with the most similar mean values. And often you cannot meet both conditions, but you know that the best compromise is in between.
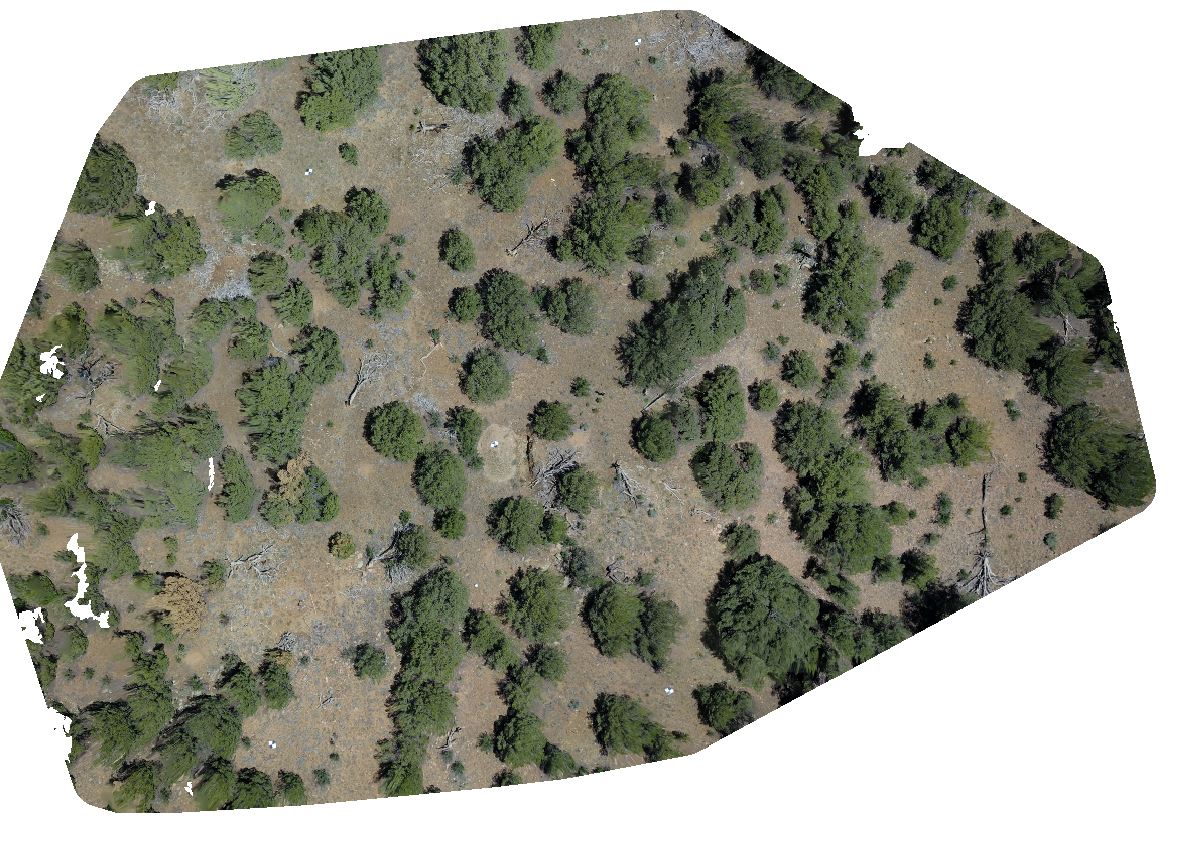
I am looking for some expert-in-the-art opinion on workflow options/approaches for analyzing images like below. My ultimate goal is to characterize the trees in 3d to simulate views at different locations on the terrain. I have been working with with the LSMS flow and other OTB tools, and obtaining reasonable results. But rather than bias any replies, I would just offer the query, what would you do. All ideas on a prospectively-optimal flow are welcome.