I’m trying to use otbcli_Mosaic (OTB 6.6.1 for ubuntu server 18.04) in order to generate an overlaping mosaic of two DEM. The problem is that the result is not as expected, and te overlaping NaN zones (the borders), appear as NaN if one of the two bands has NaNs. I tried to use the option -nodata (in https://github.com/remicres/otb-mosaic) but the parameter does not exist (maybe in the next version?).
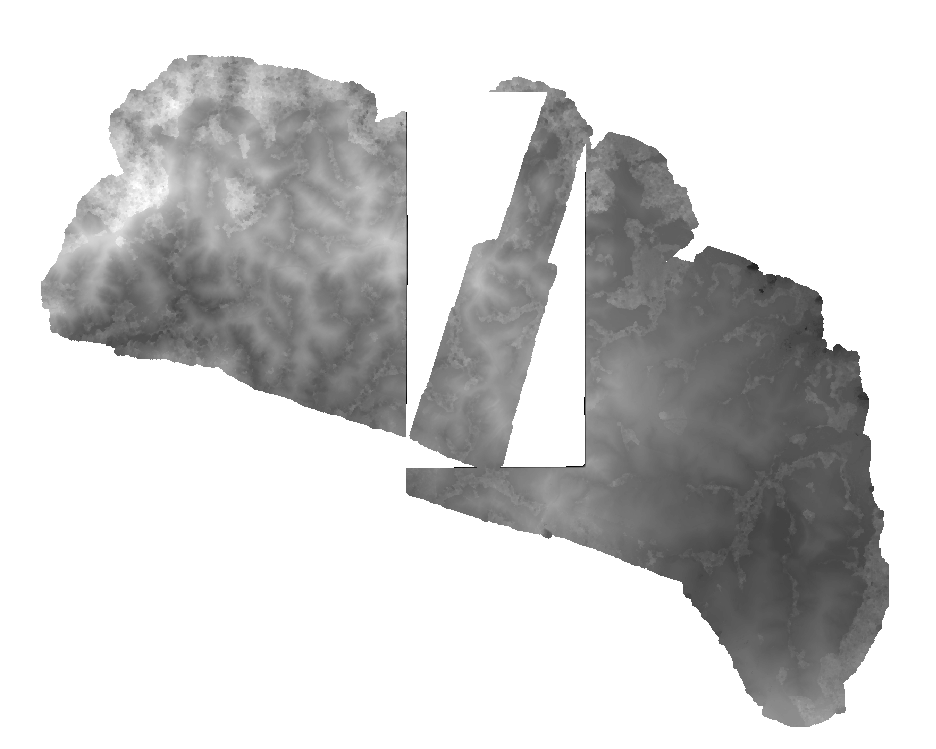
You can see that there’s problem with the overlaping borders (I wanted to show how the individual parts looks like, but I’m not yet allowed).
So far, I’ve been trying with:
otbcli_Mosaic -il DEM1.tif DEM2.tif -vdstats DEM1.shp DEM2.shp -out DEM.tif uint8 -comp.feather large -harmo.method band -harmo.cost rmse
I’ve been changing these parameters:
different harm.cost
changing vdstats for vdcut
using vdstats and vdcut at the same time
not using vdstats or vdcut
using the same shapefile for DEM1 and DEM2 (one that have both areas of interest merged)
It seems that anything I have tried, produce almost the same output.
DEM1 and DEM2 have NaN values as -9999, masked by gdal properly (gdalinfo shows that with NoData Value=-9999), but I have also tested the function with rasters with -9999 not defined as NaN. The shapefiles for vdcut/vdstats are a single feature masking all the DEM values that are not NaN.
What I’m doing wrong? Or is it nos possible to generate a mosaic as I want?
As your images are DEM, you don’t have to use radiometric or color harmonization (elevation is the same in overlapping parts),
The no-data value, as it appears in images (e.g. GeoTiff) metadata, are not always NaN values. NaN is a value that can actually exist in (computer) numbers. The Mosaic application won’t work correctly if your no-data is NaN (BTW That’s something missing from the documentation - I’ll add it!).
The vdstat and vdcut parameters are each a list of vector data that must correspond to the il parameter (AKA the list of input images).
3.1 vdstats are the masks for statistics: used only for radiometric or color harmonization (useful e.g. to remove clouds in statistics, or perform the harmonization only one some target)
3.2 vdcuts are the cutlines, i.e. the boundary of images that you want in the output mosaic. They are basically used to “crop” the input images as you want before mosaicing them.
Be careful with the output encoding. uint8 refers to unsigned 8-bits integer, meaning that you values will be encoded as integers in the range 0-255
In your case, you have two input images dem1.tif and dem2.tif that you want to mosaic together, and you want exclude the no-data pixels. Since the app currently don’t deal with NaN values, you can solve your issue in using two vector data vector1.shp and vector2.shp that represent the valid parts of your images, I mean the parts that you actually want to be mosaiced together.
Thanks you very much for your help (and quick response)! I think I’m getting closer to the expected result, at least I’m getting the full image; I’m still having small issues regarding the output values.
These DEMs I’m working with, don’t have the same value in the overlapping zones (they’re collected and generating from done imagery, from different projects), that’s the reason why I was using the feathering technique ( -comp.feather large ), but I indeed drop the harmo parameters. If I don’t use a composition method, a cutting line appear in the image (on the border on the top layer), as one will expect when there’re differences in the values.
What I also did now, was to drop the NaN values, and transform the -9999 to 0. Thanks for that clarification.
I drop the vdstat and vdcut parameters. The vector I was using already represents the valid parts of the image (DEM1 and DEM2 respectivelly).
I also drop the uint8.
Using 1 and 2, allow me to generate a smooth DEM in the overlaping zones, so I ended up using:
otbcli_Mosaic -il DEM1.tif DEM2.tif -out DEM.tif -comp.feather large
So far so good; my only actual problem is that the output DEM have slighly different values with respect to the originals DEMs; It is expected to have different values in the overlapping zones (or close to them), but not in all the new image (the difference seems to be no more than 1 meter). For example, new value is 63.05; original value in the same point is 63.52. These differences are not important in my case, but I think it’s good to know why is this happening
Could this be due to the change of NaN values to 0? Or could be due to the resampling?
This difference of values (between your mosaic and your input images) might come from:
Resampling (interpolation of pixels)
Feathering
Since you use -comp.feather large, your output mosaic results in a weighted average of the input images (for each pixel, the weight is function of the distance to the closest no-data or vdcut boundary). So whatever the interpolator used, the values will change a bit (since your DEM have slightly different values in overlapping parts). By the way, it might be appropriate to use a bicubic interpolator, in case you intend to work on DEM slope.